Seven Useful Insights from a SAN Health Check


Michael Peppers
Enterprise IT architects and data management specialists who are looking to optimize the performance and availability of their storage area network (SAN) systems will find valuable insights in the free SAN Health utility available from the NetApp website. Developed by the Brocade division of Broadcom, the world’s largest supplier of Fibre Channel (FC) network solutions, SAN Health is typically initially run by a systems engineer from NetApp or one of our many channel partners.
A previous blog post looked at how the SAN Health check is administered, and the various parts of your corporate infrastructure it explores and reports on. This time we’ll examine the main insights your organization can glean from SAN Health, and how it can help your IT staff proactively find and eliminate potential bottlenecks or other problems before they affect production.
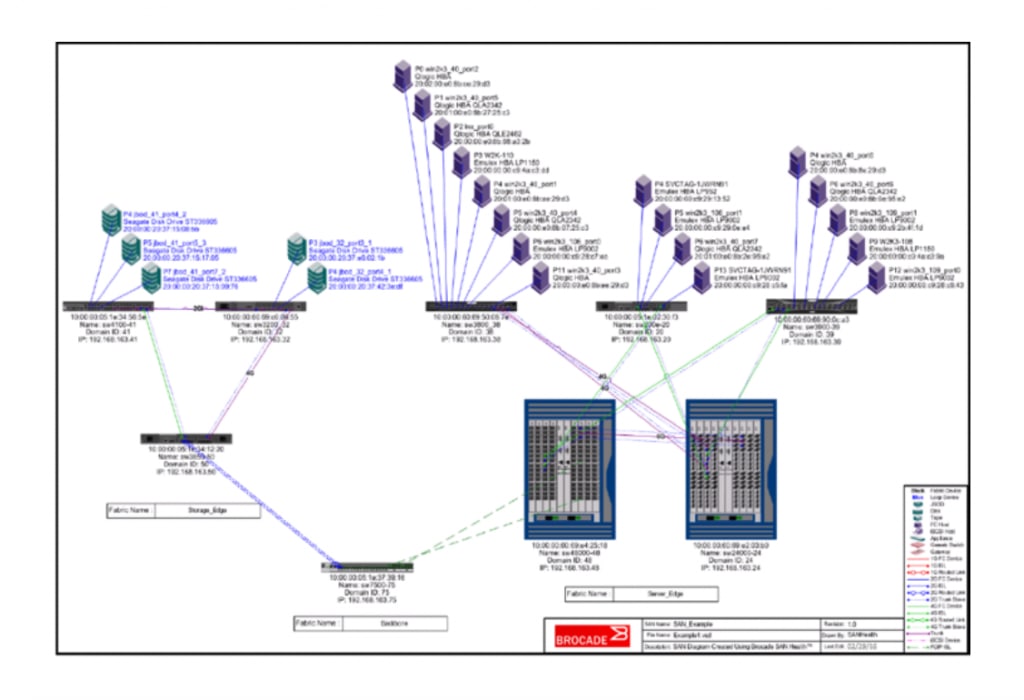 Figure 1) SAN Health Visio Topology Diagram[/caption]
 Figure 2) SAN Health Device Map[/caption]
I often talk with the solutions engineers who build and maintain SAN systems for some of the world’s largest organizations in finance, manufacturing, health care, telecommunications, and other key fields. Based on their experiences, here are the key insights observed by customers who are running the SAN Health check.
1. Strategic perspective. The topology diagram (in Visio format) gives you a bird’s-eye view of interconnections among all the components in your SAN, with icons and summary data for each fabric, host, switch, director, storage array, and application. It collects this information regardless of vendor, make, or model, even when there is no Brocade or Broadcom equipment in the fabric. If there are flaws in the overall design of your data fabric, the topology diagram helps bring them to the forefront, making it easier for your infrastructure architecture team to improve their designs. With this information, you can bring IT leaders and architects together to collaborate on a whiteboard diagram of their ideal network to meet your customers’ service level agreements (SLAs) for performance, availability, and manageability. How different is the reality shown in the topology diagram from the ideal architecture? What is your action plan to get from here to there?
2. Traffic optimization. The bandwidth usage graphs make it easy to identify workloads with exceptionally high I/O traffic. The main benefit of these graphs is that once the offending workloads are known, the fabric can be reconfigured to balance the loads, often resulting in significant improvement in overall performance. For instance, in a recent case with a customer running a variety of virtualized databases applications, our solutions engineers were able to realize significant performance gains simply by implementing load balancing. In some cases, there’s a secondary benefit: The usage graphs will highlight I/O usage well beyond expected limits for a particular workload. This enables the network admin not just to load-balance around the problem, but to tweak the operating parameters for the underlying applications and thus eliminate the problem entirely.
 Figure 3) SAN Health Performance and Throughput Graphs[/caption]
3. Mind the gap. When business-critical applications experience performance shortfalls, the consequences for the organization can be dire. Because SAN Health can drill down to the performance characteristics of each individual LUN or workload, it provides storage admins with X-ray vision that can detect configuration problems in most enterprise application workflows. Not all workloads require the same performance characteristics, and the metrics detailed in the SAN Health reports make it easy to match each workload with the appropriate resources.
4. Obsolete gear. If you have old SAN systems in your data center that are still up and running after their expected end-of-life retirement, it’s natural to just leave them there running the same old workloads. But a closer look at the SAN Health data can tell a different story–legacy systems may be so inefficient that they’re negatively affecting your ability to meet SLAs or creating real frustration for users. Support costs might have escalated to the point where it makes more sense to wheel in the forklifts, haul out the obsolete old hardware, and migrate the workloads to more modern SAN systems. In some cases, an IT organization will see such significant efficiency gains from other aspects of the SAN Health check that they’ll be able to retire obsolete storage hardware without needing to replace it.
 Figure 5) SAN Health Edge Health Summary[/caption]
5. Switch glitches. An enterprise SAN can contain hundreds or thousands of Fibre Channel switches, often different models of different generations of switches from different manufacturers–all kinds of complex variables. Plus, they’re typically running at different speeds, with multiple versions of switch software and firmware. SAN Health provides key metrics to help you manage the chaos. At a glance, you can see each switch’s name, make and model, domain, IP address, number of ports, speed, OS version, and more. You can identify used and unused ports on each switch, as well as its overall utilization. The SAN Health reports can help you easily visualize data paths and possible speed mismatches that might be causing congestion or slow drains.
 Figure 6) SAN Health Alerts[/caption]
6. Zoning out. Zones are a fundamental construct in SAN architecture, and SAN Health reveals the key data you need to make sure that your zoning has been properly configured. For each fabric, the color-coded SAN Health charts can help you find zoning configurations such as multiple initiators, zones that are too large, zones with no targets, and islands with no common zone at a glance.
 Figure 7) SAN Health Color-coding key[/caption]
7. Future-proof your data center. Solid-state flash technology quickly replaced older spinning disk data storage systems, and now NVMe (the nonvolatile memory express family of protocols and specifications) is leading the way to an even faster future. For starters, most enterprise data storage vendors have now adopted “back-end” NVMe, from the flash media to the storage array’s controller. Meanwhile, NetApp leads the way with end-to-end NVMe, where NVMe-oF protocols are also used on the “front end” to accelerate data transfer between storage controllers and hosts via NVMe over Fibre Channel (NVMe/FC). A SAN Health check is a great way to identify environmental factors where NVMe could be particularly valuable in boosting the performance of specific workloads. It can also help identify any gaps you need to address when upgrading the fabric.
Savvy IT leaders have learned the value of running SAN Health on a regular basis, especially before and after any hardware or software changes in their stack. Beyond the granular insights into architecture and performance, they find that the information they gain increases their confidence and understanding of their SAN infrastructure, documents their fabrics, improves capacity planning and productivity, and reduces the time required to troubleshoot problems when they arise. Consider adding it to your SAN toolkit today.
Do you want to optimize your SAN? Sign up for a free SAN Health check at NetApp.com.
Michael Peppers
Michael Peppers is a technical marketing engineer (TME) with a focus on SAN, FlexArray/V-Series, QoS, FLI, and NVMe in ONTAP. His TME mission is to broaden and deepen the SAN, FlexArray & related knowledge of customers, partners, and coworkers, and increase the scope of NetApp's SAN & FlexArray solutions. Prior to becoming a TME Mike tested ONTAP SAN Interoperability in engineering quality assurance, before that, was an Escalations Engineer in the NetApp Technical Support Center. Before joining NetApp in 2005, Mike was a Networking and Systems administrator for several of US-based corporations.